Okay, this is silly.
I can't use Flash here. If I upload the animation as an AVI, it's resized to matchbox resolution. And, if I upload it as an animated GIF, the server automatically removes all frames except the first one.
Thursday, April 8, 2010

Sunday, April 4, 2010
Trends, deviations, and investors
In his latest blog entry, Rich Toscano at Piggington.com looks at dynamics of different price tiers in San Diego and makes an observation that all three tiers appear to have converged by early 2009. He then concludes that the recent rebound in the lower tiers must have been caused by government stimulus rather than economic fundamentals.
Whether or not government stimulus had much impact on prices, that I can not say. I also can't comment on tiered Case-Shiller numbers, since I never was able to reproduce them myself. I do want to make a point that it's inaccurate to claim that relationships between prices were back to what "prevailed before the era of reckless mortgage finance".
Differences did exist, and they were severe. By mid-'09, there were parts of the county where prices were up 80-90% or more compared with early 2000 (these were mostly in the top tier), and there were those where prices were up only 20-30% (usually in the lower tier, though there were deviations.)
The following crude map should illustrate the point. It shows approximate price changes from January 2000 to July 2009.

Notice a red band along the coast west of the I-5. As of mid-2009, places like Del Mar, Solana Beach, Pacific Beach, all had "effective Case-Shiller" above 190 (meaning that a typical detached property in the area gained 90% or more in value since 2000). Hillcrest was at 185 and Rancho Penasquitos was at 180.
At the other extreme, we have dark blue areas inland and south of downtown. Some of them are generally thought to be poor and dangerous (zip code 92113: 120), others are too out of the way to attract prospective buyers with jobs near the coast (Valley Center: 133, Ramona: 136), but, for one or the other reason, they were all driven down towards or below historical trend.
Now, what is behind the lower tier rebound? The first-time buyer tax credit and low down payment FHA loans may certainly play some role. However, we're seeing strong rebound even in areas where FHA-equipped first time buyers generally fear to tread. Median FICO score of a FHA buyer is above 690 by now. It's hard to imagine throngs of FICO-700 homebuyers rushing to capture properties in Logan Heights and Spring Valley.
We do hear tales of prospective homebuyers struggling to compete with real estate investors. It could be that the relentless influx of subprime foreclosures brought prices in some areas low enough to make sense from rental cash-flow standpoint.
As evidence towards that point of view, depressed areas where properties are not easily rented out (Jamul or Valley Center) do not seem to experience any kind of rebound at all.
Whether or not government stimulus had much impact on prices, that I can not say. I also can't comment on tiered Case-Shiller numbers, since I never was able to reproduce them myself. I do want to make a point that it's inaccurate to claim that relationships between prices were back to what "prevailed before the era of reckless mortgage finance".
Differences did exist, and they were severe. By mid-'09, there were parts of the county where prices were up 80-90% or more compared with early 2000 (these were mostly in the top tier), and there were those where prices were up only 20-30% (usually in the lower tier, though there were deviations.)
The following crude map should illustrate the point. It shows approximate price changes from January 2000 to July 2009.

Notice a red band along the coast west of the I-5. As of mid-2009, places like Del Mar, Solana Beach, Pacific Beach, all had "effective Case-Shiller" above 190 (meaning that a typical detached property in the area gained 90% or more in value since 2000). Hillcrest was at 185 and Rancho Penasquitos was at 180.
At the other extreme, we have dark blue areas inland and south of downtown. Some of them are generally thought to be poor and dangerous (zip code 92113: 120), others are too out of the way to attract prospective buyers with jobs near the coast (Valley Center: 133, Ramona: 136), but, for one or the other reason, they were all driven down towards or below historical trend.
Now, what is behind the lower tier rebound? The first-time buyer tax credit and low down payment FHA loans may certainly play some role. However, we're seeing strong rebound even in areas where FHA-equipped first time buyers generally fear to tread. Median FICO score of a FHA buyer is above 690 by now. It's hard to imagine throngs of FICO-700 homebuyers rushing to capture properties in Logan Heights and Spring Valley.
We do hear tales of prospective homebuyers struggling to compete with real estate investors. It could be that the relentless influx of subprime foreclosures brought prices in some areas low enough to make sense from rental cash-flow standpoint.
As evidence towards that point of view, depressed areas where properties are not easily rented out (Jamul or Valley Center) do not seem to experience any kind of rebound at all.
Thursday, April 1, 2010


Wednesday, March 31, 2010
March '10 price crash
As you may have heard, the Fed has recently ended its mortgage-backed security buying program. Furthermore, Bank of America is increasing the foreclosure rate of its properties, from 7,500 homes a month nationally, with the goal to increase that number to 45,000 homes per month by December of 2010. On top of that, there's evidence of increased strategic defaults, and the $8,000 first-time homebuyer credit is about to expire.
All these factors, combined, appear to have created a perfect storm in the housing market. Just in the last month alone, all San Diego sub-markets crashed 10+% across the board, and it looks like the decline will only accelerate from this point on.

All these factors, combined, appear to have created a perfect storm in the housing market. Just in the last month alone, all San Diego sub-markets crashed 10+% across the board, and it looks like the decline will only accelerate from this point on.

Thursday, March 4, 2010

Monday, February 1, 2010
January '10 HPI
I missed a couple of months, but, fortunately, there was nothing interesting going on in the mean time.


Saturday, November 7, 2009
October '09


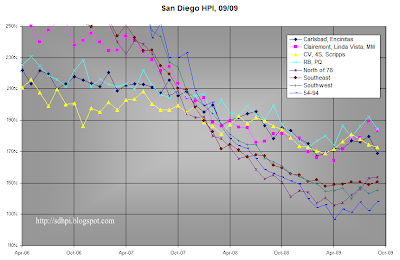
Clairemont and Mira Mesa appear to have staged a strong recovery. Here's a different perspective - smoothed median prices of a few different mid-range neighborhoods over time, and one top-tier neighborhood thrown in for comparison:

If we take two properties, one in Mira Mesa and the other in Ramona, that were worth the same amount, say, 300k in early '02, assuming no structural changes, the one in Mira Mesa is now worth 400k and the one in Ramona is only worth 325k. Other similarly priced peripheral locales, such as Alpine and Fallbrook, have also been underperforming. One possible explanation is that strength of Clairemont and Mira Mesa is due to their proximity to Sorrento Valley / University City tech hub, which has been affected by the downturn to a lesser degree than most of the city.
Friday, October 9, 2009
Temecula update
Unlike San Diego, the overhang of delinquent inventory in Temecula is so heavy that the summer rally was only able to stabilize prices for a while:


Friday, October 2, 2009
According to my calculations, city average index is now up slightly year-over-year:

The official July Case-Shiller read came in at 150.99, in agreement with my expectations. The forecast is 154.5 for August, 158.0 for September, ~160 for October. At this point I don't expect any official reads indicating month-to-month declines before the end of the year (since the October number comes out around Christmas).
I have to caution against identifying this dynamics as genuine recovery, there's quite a bit of nonmarket stuff going on (the first-time-buyer tax credit, "shadow inventory", some degree of mortgage interest rate manipulation by the Fed), but the market appears to be robust and this uptrend has gone far beyond any seasonal fluctuations.


The official July Case-Shiller read came in at 150.99, in agreement with my expectations. The forecast is 154.5 for August, 158.0 for September, ~160 for October. At this point I don't expect any official reads indicating month-to-month declines before the end of the year (since the October number comes out around Christmas).
I have to caution against identifying this dynamics as genuine recovery, there's quite a bit of nonmarket stuff going on (the first-time-buyer tax credit, "shadow inventory", some degree of mortgage interest rate manipulation by the Fed), but the market appears to be robust and this uptrend has gone far beyond any seasonal fluctuations.
Thursday, September 3, 2009
On shadow inventory
As promised, a word or two about shadow inventory. It didn't turn out particularly illuminating, but here goes.
First of all, I'm not a serious corporation like RealtyTrac or ForeclosureRadar, and I don't have access to their (paid-for) databases. I tried to put together some numbers using free public sources. To do that, I pulled the index of the San Diego grantor-grantee database (http://www.sdarcc.com) and looked for some patterns.
The grantor-grantee database is a place where many important real estate transactions and events are recorded. Some well known types of events are notices of default (NOD) and notices of trustee sale (NOT or NTS). The database also contains records of trustee sales, transfers (deeds), and some of the less known events. The complete database is, unfortunately, unavailable online, but its index is. The index contains document numbers, dates and names. So, for example, I might find out that a Mr. John Smith (a made-up name) received a Notice of Default on 7/30/2008 and a Trustees Deed on 11/15/2008. Of course, I can't be sure that the two refer to the same property, but it's a reasonable assumption.
These are my preliminary results.

Areas marked as "Foreclosure" and "Short sale" refer to NODs that were followed by an ownership transfer (i.e. the former owner is no longer in possession of the property). This simple approach does not allow me to track the property any further - if the bank chooses to "sit" on the property after foreclosing, there's no way for me to tell that. Anecdotal information suggests that it does not happen often.
Next two: "Reconveyance" and "Rescission". Reconveyance is recorded when the bank releases interest in the property (because the loan was paid off or refinanced). It appears that very few people have been able to refinance their way out of default. Rescission means that the bank "rescinds" a previously recorded document for any reason - for example, because the loan was modified. A NOD followed by a rescission probably indicates that the borrower is now okay.
That leaves us with the last two categories: "NTS" and "No action". This is where our shadow inventory would live. Some borrowers are in this category because they got a loan modification, but the bank never bothered to rescind the NOD or the NTS. Others are there because they are trying to complete a short sale. Those that don't conform to either of these situations, probably represent the true shadow inventory.
There's typically a 3-4 month delay between a NOD and a NTS. It means that May '09 and later defaults are not "shadow inventory" yet, they are still in the pipeline. The total number of "uncured" non-duplicate defaults between 7/1/2008 and 4/30/2009 is 10,335. That's the upper bound on the size of shadow inventory in San Diego county. The actual number is most likely lower.
My next step is to head to the nearest county clerk's office and run some names. I heard that it's possible to access the grantor-grantee database directly for free from a public computer in any county clerk's office. That should clear things up. I want to estimate how many people in "NTS" and "No action" categories are current on their property taxes. For people who defaulted substantially earlier than 4/10 (when the most recent installment of the property tax was due), property tax status should be a good test of distress.
First of all, I'm not a serious corporation like RealtyTrac or ForeclosureRadar, and I don't have access to their (paid-for) databases. I tried to put together some numbers using free public sources. To do that, I pulled the index of the San Diego grantor-grantee database (http://www.sdarcc.com) and looked for some patterns.
The grantor-grantee database is a place where many important real estate transactions and events are recorded. Some well known types of events are notices of default (NOD) and notices of trustee sale (NOT or NTS). The database also contains records of trustee sales, transfers (deeds), and some of the less known events. The complete database is, unfortunately, unavailable online, but its index is. The index contains document numbers, dates and names. So, for example, I might find out that a Mr. John Smith (a made-up name) received a Notice of Default on 7/30/2008 and a Trustees Deed on 11/15/2008. Of course, I can't be sure that the two refer to the same property, but it's a reasonable assumption.
These are my preliminary results.

Areas marked as "Foreclosure" and "Short sale" refer to NODs that were followed by an ownership transfer (i.e. the former owner is no longer in possession of the property). This simple approach does not allow me to track the property any further - if the bank chooses to "sit" on the property after foreclosing, there's no way for me to tell that. Anecdotal information suggests that it does not happen often.
Next two: "Reconveyance" and "Rescission". Reconveyance is recorded when the bank releases interest in the property (because the loan was paid off or refinanced). It appears that very few people have been able to refinance their way out of default. Rescission means that the bank "rescinds" a previously recorded document for any reason - for example, because the loan was modified. A NOD followed by a rescission probably indicates that the borrower is now okay.
That leaves us with the last two categories: "NTS" and "No action". This is where our shadow inventory would live. Some borrowers are in this category because they got a loan modification, but the bank never bothered to rescind the NOD or the NTS. Others are there because they are trying to complete a short sale. Those that don't conform to either of these situations, probably represent the true shadow inventory.
There's typically a 3-4 month delay between a NOD and a NTS. It means that May '09 and later defaults are not "shadow inventory" yet, they are still in the pipeline. The total number of "uncured" non-duplicate defaults between 7/1/2008 and 4/30/2009 is 10,335. That's the upper bound on the size of shadow inventory in San Diego county. The actual number is most likely lower.
My next step is to head to the nearest county clerk's office and run some names. I heard that it's possible to access the grantor-grantee database directly for free from a public computer in any county clerk's office. That should clear things up. I want to estimate how many people in "NTS" and "No action" categories are current on their property taxes. For people who defaulted substantially earlier than 4/10 (when the most recent installment of the property tax was due), property tax status should be a good test of distress.
Tuesday, September 1, 2009
August '09
With kids back to school, it looks like the summer rally finally ran out of steam.

MLS inventory is still tight, but there are fewer buyers around, so prices will probably move sideways or decline somewhat in the upcoming months.
July Case-Shiller forecast is revised down to ~155 from 158 (last official read was 147.31). At this point, I can't give any firm predictions as to the August value, except to say that it'll most likely be in 156-159 range.


MLS inventory is still tight, but there are fewer buyers around, so prices will probably move sideways or decline somewhat in the upcoming months.
July Case-Shiller forecast is revised down to ~155 from 158 (last official read was 147.31). At this point, I can't give any firm predictions as to the August value, except to say that it'll most likely be in 156-159 range.

Saturday, August 1, 2009
July '09
City average: 39.1% off the peak, 57.9% above Dec 1999
Top tier: 20.1% off the peak, 80.1% above Dec 1999
Middle tier: 39.9% off the peak, 55.3% above Dec 1999
Bottom tier: 50.9% off the peak, 42.5% above Dec 1999


The market is really heating up. The overall city index is up 5% in one month, which is the highest rate of change in the recent history, even exceeding records set during the spring of 2004.
There's one caveat, though - this exponential-looking growth is partly caused by a change in sales structure: the ratio of top tier sales to middle tier sales seems to be up about 20% compared with the previous month. Middle tier by itself is up "only" 3%. It may be an artifact in my data, since some sales may not yet be reported yet, maybe top tier sales are reported faster. I'll update charts and numbers when late-reporters become available.
Also, it's already August and the frenzy may subside in a month or two.
Here's my forecast of the official Case-Shiller index for the next three months:

I've rescaled the "SDHPI" curve to match up exactly with last month's official reading.
Final point is less certain since I need August sales to calculate it precisely - but it should be roughly in that area.
Top tier: 20.1% off the peak, 80.1% above Dec 1999
Middle tier: 39.9% off the peak, 55.3% above Dec 1999
Bottom tier: 50.9% off the peak, 42.5% above Dec 1999


The market is really heating up. The overall city index is up 5% in one month, which is the highest rate of change in the recent history, even exceeding records set during the spring of 2004.
There's one caveat, though - this exponential-looking growth is partly caused by a change in sales structure: the ratio of top tier sales to middle tier sales seems to be up about 20% compared with the previous month. Middle tier by itself is up "only" 3%. It may be an artifact in my data, since some sales may not yet be reported yet, maybe top tier sales are reported faster. I'll update charts and numbers when late-reporters become available.
Also, it's already August and the frenzy may subside in a month or two.
Here's my forecast of the official Case-Shiller index for the next three months:

I've rescaled the "SDHPI" curve to match up exactly with last month's official reading.
Final point is less certain since I need August sales to calculate it precisely - but it should be roughly in that area.
Friday, July 3, 2009

Thursday, July 2, 2009
June '09
City average: 42.1% off the peak, 50.1% above Dec 1999
Top tier: 21.2% off the peak, 77.3% above Dec 1999
Middle tier: 41.6% off the peak, 50.9% above Dec 1999
Bottom tier: 51.8% off the peak, 40.0% above Dec 1999
City average is up for the third month in a row, so far up 5.7% from March trough.


Top tier: 21.2% off the peak, 77.3% above Dec 1999
Middle tier: 41.6% off the peak, 50.9% above Dec 1999
Bottom tier: 51.8% off the peak, 40.0% above Dec 1999
City average is up for the third month in a row, so far up 5.7% from March trough.


Monday, June 1, 2009
May '09
May index is up slightly in all tiers and most sub-areas.
City average: 42.7% off the peak, 48.1% above Dec 1999
Top tier: 21.3% off the peak, 77.3% above Dec 1999
Middle tier: 42.7% off the peak, 47.8% above Dec 1999
Bottom tier: 51.4% off the peak, 41.1% above Dec 1999
Short term, upward movement should continue for at least a couple of months, due to tight MLS inventory and active homebuying among families with school-age children - unless mortgage rates spike past 7% or something else equally bad happens. Things will get more interesting in September-October. There's talk of considerable "shadow inventory" due to foreclosure moratoria & such, I'll try to address this issue in a later post.
Regarding the official Case-Shiller index with 3-month averaging, next month's numbers for San Diego should be flat or slightly down, but May C-S will definitely be up (due to be released July 28, if I'm not mistaken) and so far it looks like June C-S (due end of August) will be up as well.


City average: 42.7% off the peak, 48.1% above Dec 1999
Top tier: 21.3% off the peak, 77.3% above Dec 1999
Middle tier: 42.7% off the peak, 47.8% above Dec 1999
Bottom tier: 51.4% off the peak, 41.1% above Dec 1999
Short term, upward movement should continue for at least a couple of months, due to tight MLS inventory and active homebuying among families with school-age children - unless mortgage rates spike past 7% or something else equally bad happens. Things will get more interesting in September-October. There's talk of considerable "shadow inventory" due to foreclosure moratoria & such, I'll try to address this issue in a later post.
Regarding the official Case-Shiller index with 3-month averaging, next month's numbers for San Diego should be flat or slightly down, but May C-S will definitely be up (due to be released July 28, if I'm not mistaken) and so far it looks like June C-S (due end of August) will be up as well.


Sunday, May 24, 2009
UC enrollment stats
Last year, just over 2200 high school graduates from San Diego County enrolled into one of the UC universities.
Which high schools were the most likely to send their students to the UC system?
I found the admissions database and used it to compute 3-year average enrollment rates for all major San Diego high schools ("major" defined as having 1000 or more students in 2008).
The overall ranking should not be very surprising to anyone who spent any time studying school characteristics such as API - quite naturally, Torrey Pines High is on top, with 19.4% UC enrollment rate; three out of four Poway USD schools are in the top 10, the exception being Poway High at #12; three SDUSD schools made top 10, namely La Jolla High (#4, 14.5%), Scripps Ranch High (#8, 12.1%), University City High (#9, 9.8%).
There are some deviations from the common API rating. As mentioned, University City High is in the top 10 (an average of 46 students or 9.8%), even though it's only API rank 7. San Marcos High (also API rank 7) had a remarkably bad showing during the last few years, sending an average of 13 students or 2.8% of its graduating class to UC during 2006-08. But overall the pattern is familiar.
What's interesting though is that the distribution is not quite as extreme as one could have expected. On one hand, high-end percentages are surprisingly low. Sure, some students from TPHS go to private schools such as Stanford or Ivy League universities ... but there are probably fewer of those than the number admitted to UC. On the other hand, the distribution has a long thick tail. Combined together, San Dieguito, Carlsbad, and Poway schools provide only a third of all UC freshmen. Why? Because even schools like Morse High (SE San Diego) and Fallbrook High have UC enrollment rates in 4-5% range.
Top 20:
1 Torrey Pines High 19.4%
2 San Dieguito High Academy 18.3%
3 Westview High 15.5%
4 La Jolla Senior High 14.5%
5 Canyon Crest Academy 13.3%
6 Rancho Bernardo High 12.8%
7 La Costa Canyon High 12.5%
8 Scripps Ranch High 12.1%
9 University City High 9.8%
10 Mt. Carmel High 9.6%
11 Coronado High 8.4%
12 Poway High 8.3%
13 Mira Mesa High 7.8%
14 Carlsbad High 7.5%
15 Bonita Vista Senior High 7.1%
16 Henry High 6.8%
17 Eastlake High 5.9%
18 Otay Ranch Senior High 5.7%
19 San Pasqual High 5.6%
20 Point Loma High 5.5%
Which high schools were the most likely to send their students to the UC system?
I found the admissions database and used it to compute 3-year average enrollment rates for all major San Diego high schools ("major" defined as having 1000 or more students in 2008).
The overall ranking should not be very surprising to anyone who spent any time studying school characteristics such as API - quite naturally, Torrey Pines High is on top, with 19.4% UC enrollment rate; three out of four Poway USD schools are in the top 10, the exception being Poway High at #12; three SDUSD schools made top 10, namely La Jolla High (#4, 14.5%), Scripps Ranch High (#8, 12.1%), University City High (#9, 9.8%).
There are some deviations from the common API rating. As mentioned, University City High is in the top 10 (an average of 46 students or 9.8%), even though it's only API rank 7. San Marcos High (also API rank 7) had a remarkably bad showing during the last few years, sending an average of 13 students or 2.8% of its graduating class to UC during 2006-08. But overall the pattern is familiar.
What's interesting though is that the distribution is not quite as extreme as one could have expected. On one hand, high-end percentages are surprisingly low. Sure, some students from TPHS go to private schools such as Stanford or Ivy League universities ... but there are probably fewer of those than the number admitted to UC. On the other hand, the distribution has a long thick tail. Combined together, San Dieguito, Carlsbad, and Poway schools provide only a third of all UC freshmen. Why? Because even schools like Morse High (SE San Diego) and Fallbrook High have UC enrollment rates in 4-5% range.
Top 20:
1 Torrey Pines High 19.4%
2 San Dieguito High Academy 18.3%
3 Westview High 15.5%
4 La Jolla Senior High 14.5%
5 Canyon Crest Academy 13.3%
6 Rancho Bernardo High 12.8%
7 La Costa Canyon High 12.5%
8 Scripps Ranch High 12.1%
9 University City High 9.8%
10 Mt. Carmel High 9.6%
11 Coronado High 8.4%
12 Poway High 8.3%
13 Mira Mesa High 7.8%
14 Carlsbad High 7.5%
15 Bonita Vista Senior High 7.1%
16 Henry High 6.8%
17 Eastlake High 5.9%
18 Otay Ranch Senior High 5.7%
19 San Pasqual High 5.6%
20 Point Loma High 5.5%
Saturday, May 2, 2009
April '09
City average: 44.5% off the peak, 43.3% above Dec 1999
Top tier: 24.0% off the peak, 71.1% above Dec 1999
Middle tier: 43.9% off the peak, 44.8% above Dec 1999
Bottom tier: 53.0% off the peak, 36.5% above Dec 1999


Top tier: 24.0% off the peak, 71.1% above Dec 1999
Middle tier: 43.9% off the peak, 44.8% above Dec 1999
Bottom tier: 53.0% off the peak, 36.5% above Dec 1999


Wednesday, April 1, 2009
March '09
(Will be updated in a few days to include late reporters and more graphs)
City average: 45.2% off the peak, 41.5% above Dec 1999 (Case-Shiller index: 141.5); 2.5% down month to month, 22.6% down year over year
Top tier: 24.0% o8ff the peak, 71.1% above Dec 1999
Middle tier: 43.7% off the peak, 44.8% above Dec 1999
Bottom tier: 51.8% off the peak, 39.6% above Dec 1999
City average: 45.2% off the peak, 41.5% above Dec 1999 (Case-Shiller index: 141.5); 2.5% down month to month, 22.6% down year over year
Top tier: 24.0% o8ff the peak, 71.1% above Dec 1999
Middle tier: 43.7% off the peak, 44.8% above Dec 1999
Bottom tier: 51.8% off the peak, 39.6% above Dec 1999
Thursday, March 26, 2009
Saturday, February 28, 2009
February '09
Last summer I made a bold call for a bottom in February '09. Six months, one stock market crash and one huge stimulus bill later, it's time to see where we are.
My basic model did not anticipate a rapid-onset recession and a 40% drop in Dow that decimated down-payment savings of top tier buyers and 401k's of pretty much everyone else. It also did not anticipate 4.625% interest rates and fat tax credits to new homebuyers. I made the forecast when oil was around $115/barrel and everyone was afraid of $200/barrel. Today it's $44.
The forecast was for a bottom in 150-155 range and we're certainly lower than that. And since interest rates are lower too, houses are quite a bit more affordable than I expected. Would that be enough to bring enough buyers out of the woods to stabilize prices?
City average: 43.4% off the peak, 44.8% above December 1999 (predicted March '09 Case-Shiller for San Diego: 144.8)
Top tier: 24.8% off the peak, 66.3% above December 1999
Middle tier: 42.0% off the peak, 47.6% above December 1999
Bottom tier: 50.4% off the peak, 42.5% above December 1999
As you may know, official C-S applies 3-month "smoothing" (averaging) to all numbers - one of the reasons why they are so much behind. To calculate final "March 2009" C-S, we need to look at sales through the end of March (even though it's most representative of sales in February). I get around that by publishing an estimate that's based on a single month of sales, then revising it a month later.
3-month averaging raises revised overall "February 2009" Case-Shiller to 146.1 - we still appear to be down month-to-month. However, we'll see what averaging does to today's number.
Middle tier is the most populous one - 50% of all houses - and it held up very well last month. Non-smoothed index for the middle tier is up 1.6% month-to-month, which is the first increase since 2007.
Top tier is still getting hammered, but the stimulus bill increased conforming loan limits from 546K to 697K as of February 18 and that may slow down the decline.


Is this the bottom (or at least "a" bottom)? Too soon to tell - we need a couple of months of steady appreciation to know for sure - but it's possible.
My basic model did not anticipate a rapid-onset recession and a 40% drop in Dow that decimated down-payment savings of top tier buyers and 401k's of pretty much everyone else. It also did not anticipate 4.625% interest rates and fat tax credits to new homebuyers. I made the forecast when oil was around $115/barrel and everyone was afraid of $200/barrel. Today it's $44.
The forecast was for a bottom in 150-155 range and we're certainly lower than that. And since interest rates are lower too, houses are quite a bit more affordable than I expected. Would that be enough to bring enough buyers out of the woods to stabilize prices?
City average: 43.4% off the peak, 44.8% above December 1999 (predicted March '09 Case-Shiller for San Diego: 144.8)
Top tier: 24.8% off the peak, 66.3% above December 1999
Middle tier: 42.0% off the peak, 47.6% above December 1999
Bottom tier: 50.4% off the peak, 42.5% above December 1999
As you may know, official C-S applies 3-month "smoothing" (averaging) to all numbers - one of the reasons why they are so much behind. To calculate final "March 2009" C-S, we need to look at sales through the end of March (even though it's most representative of sales in February). I get around that by publishing an estimate that's based on a single month of sales, then revising it a month later.
3-month averaging raises revised overall "February 2009" Case-Shiller to 146.1 - we still appear to be down month-to-month. However, we'll see what averaging does to today's number.
Middle tier is the most populous one - 50% of all houses - and it held up very well last month. Non-smoothed index for the middle tier is up 1.6% month-to-month, which is the first increase since 2007.
Top tier is still getting hammered, but the stimulus bill increased conforming loan limits from 546K to 697K as of February 18 and that may slow down the decline.


Is this the bottom (or at least "a" bottom)? Too soon to tell - we need a couple of months of steady appreciation to know for sure - but it's possible.
Subscribe to:
Posts (Atom)